Cartographic Projections: Representing the Impossible
How can we flatten the Earth? This question, seemingly absurd, lies at the heart of cartography. Representing a three‑dimensional globe on a flat sheet is a complex and always imperfect exercise. Whether for school, navigation, or spatial analysis, maps are everywhere. And behind every map—even Google Maps—there is a map projection, meaning a transformation method that chooses what to preserve and what to sacrifice.
The Major Types of Projections
Projections are often classified according to the geometric surface used to “project” the Earth:
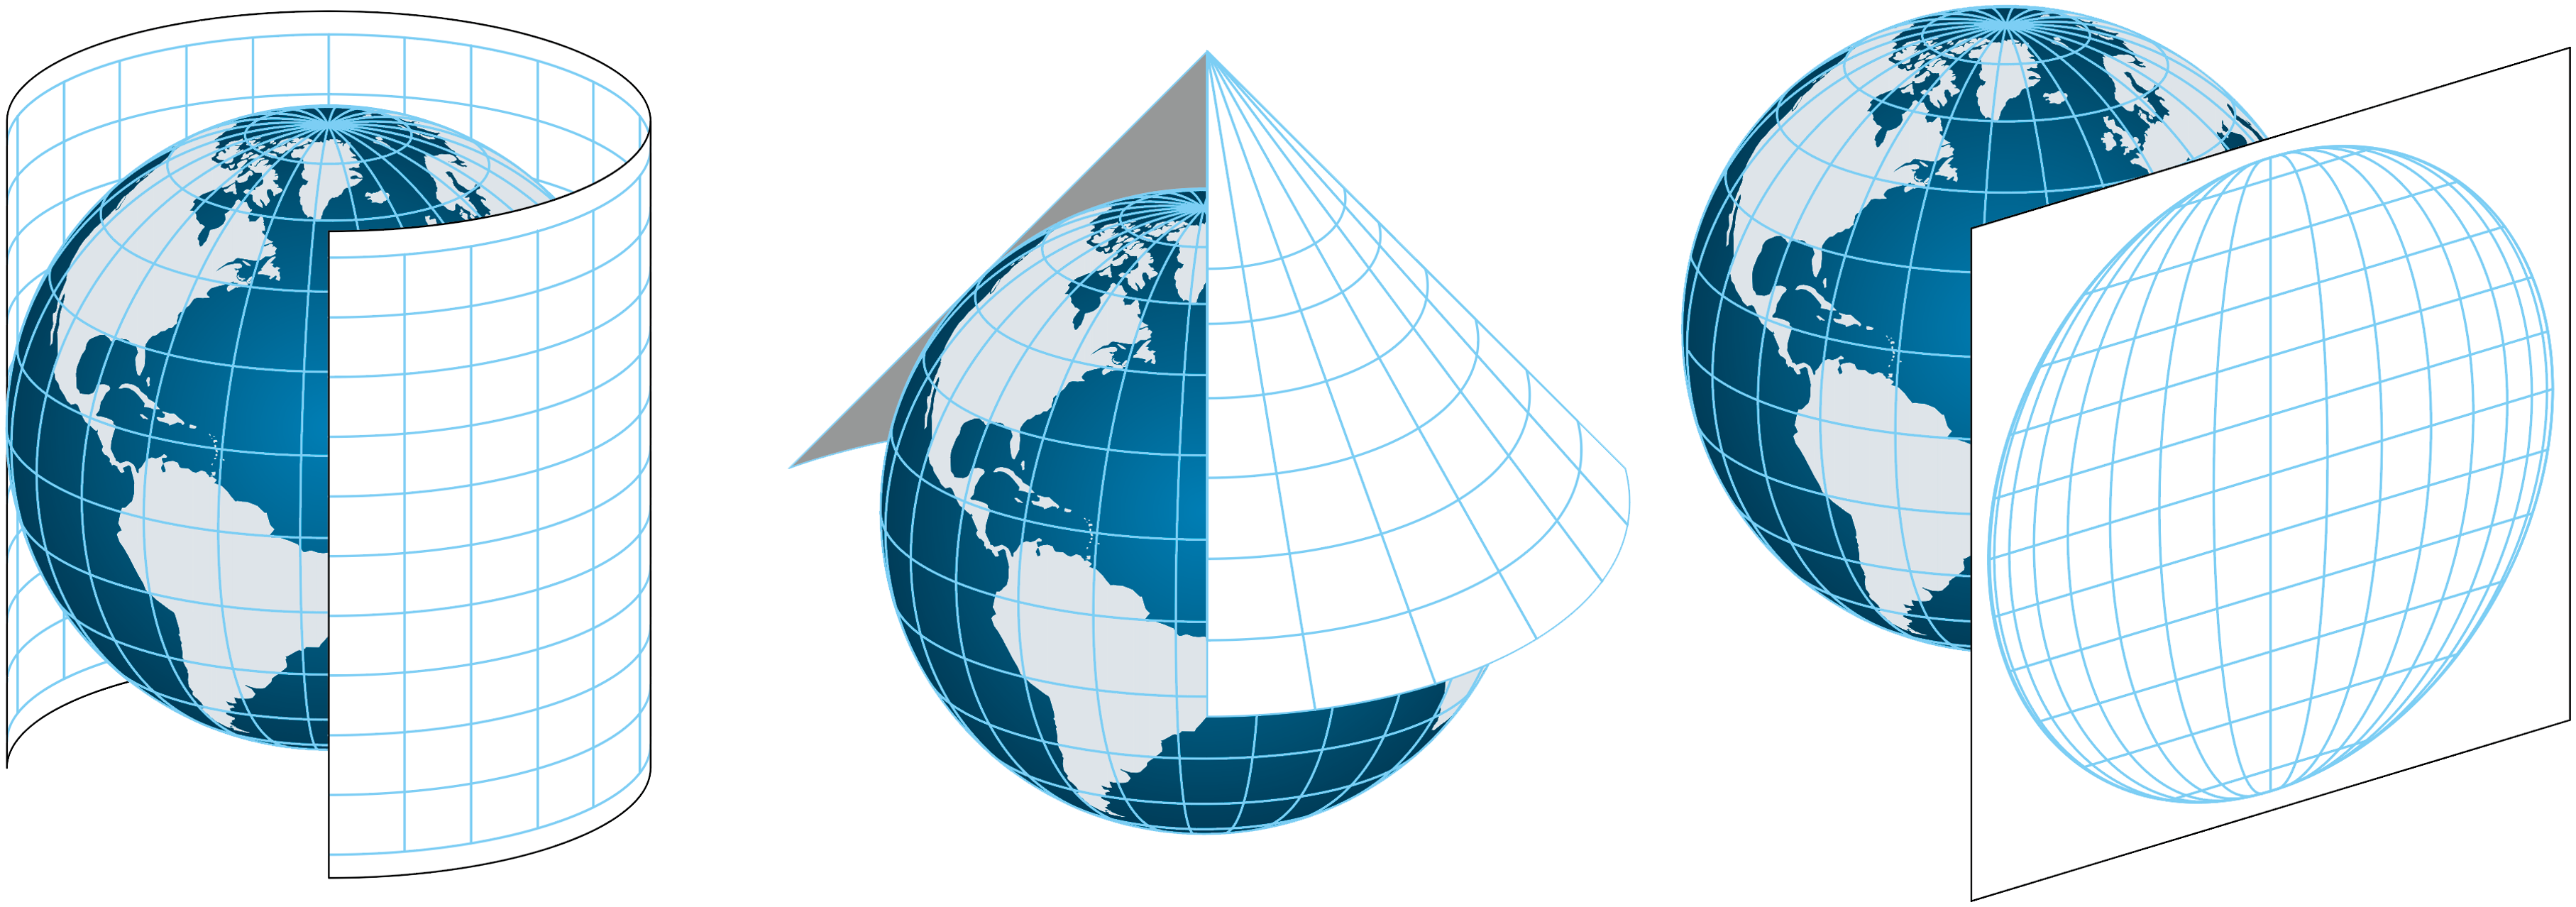
Cylindrical Projection: As if wrapping a cylinder around the globe, tangent to the equator or another parallel.
Conic Projection: The Earth is projected onto a cone touching one or two parallels (e.g., Lambert conformal).
Planar (Azimuthal) Projection: The projection is made onto a plane tangent (or secant) at a point, often centered on a pole or strategic location.
There are also compromise projections, which combine characteristics of planar, conic, and cylindrical projections. They are designed to visually reduce distortions without prioritizing one property over another.
Each type has its strengths and weaknesses.
Types of Distortions
It is impossible to represent everything accurately on a flat map. One must choose between four major geographic properties:
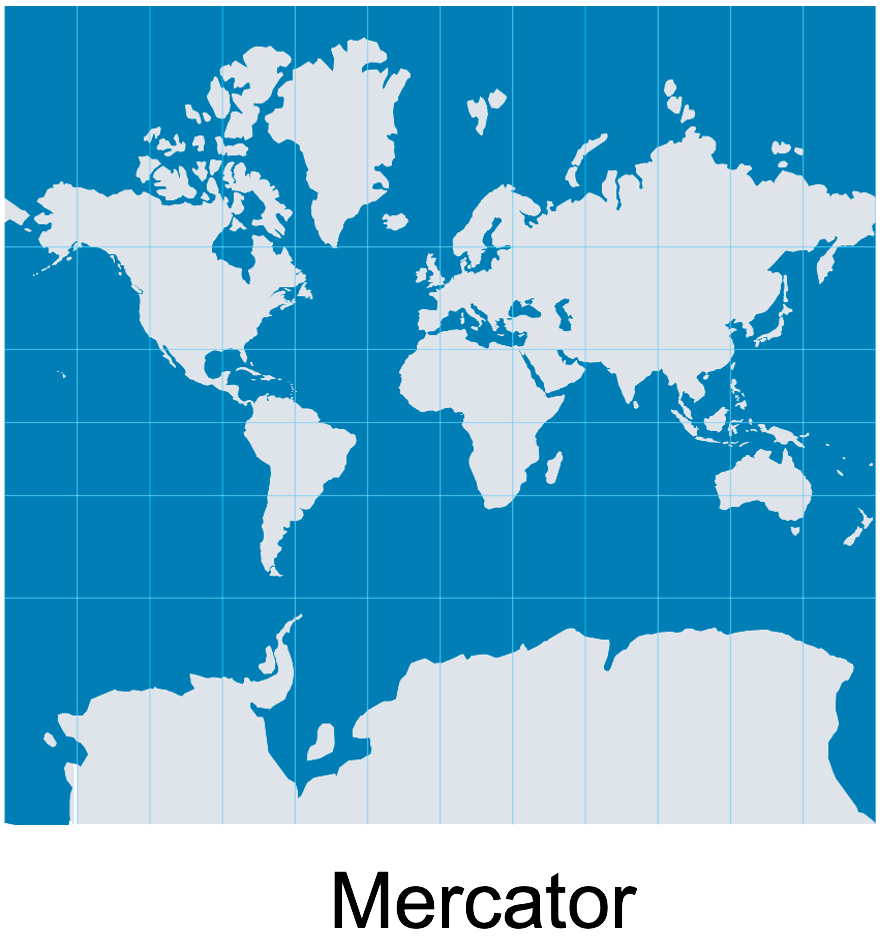
Conformality (Mercator)
Preserves local shapes and angles
Faithfully preserves the shapes of small objects by maintaining local angles
- Ideal for coastal, marine, and topographic maps
- Areas can be greatly exaggerated, especially near the poles
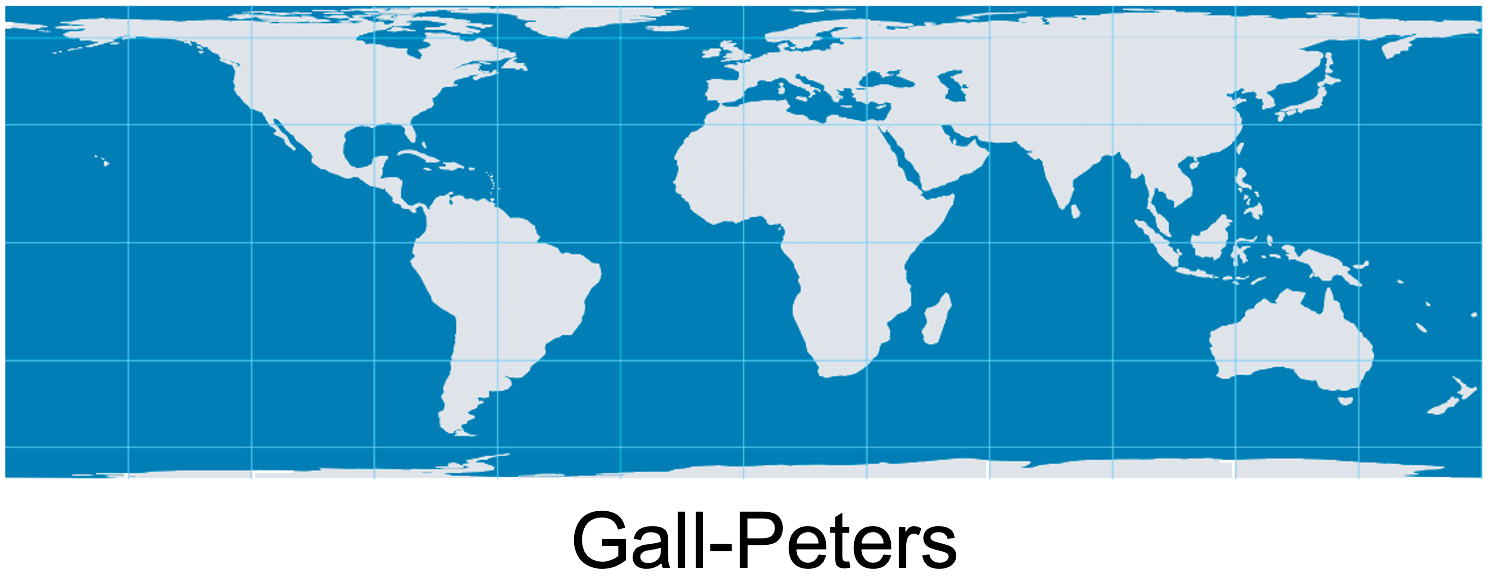
Equivalence (Gall–Peters)
Preserves area
The areas shown on the map are proportional to those in the real world
- Crucial in political geography, demography, and economics
- Shapes may appear stretched, distorted, or flattened
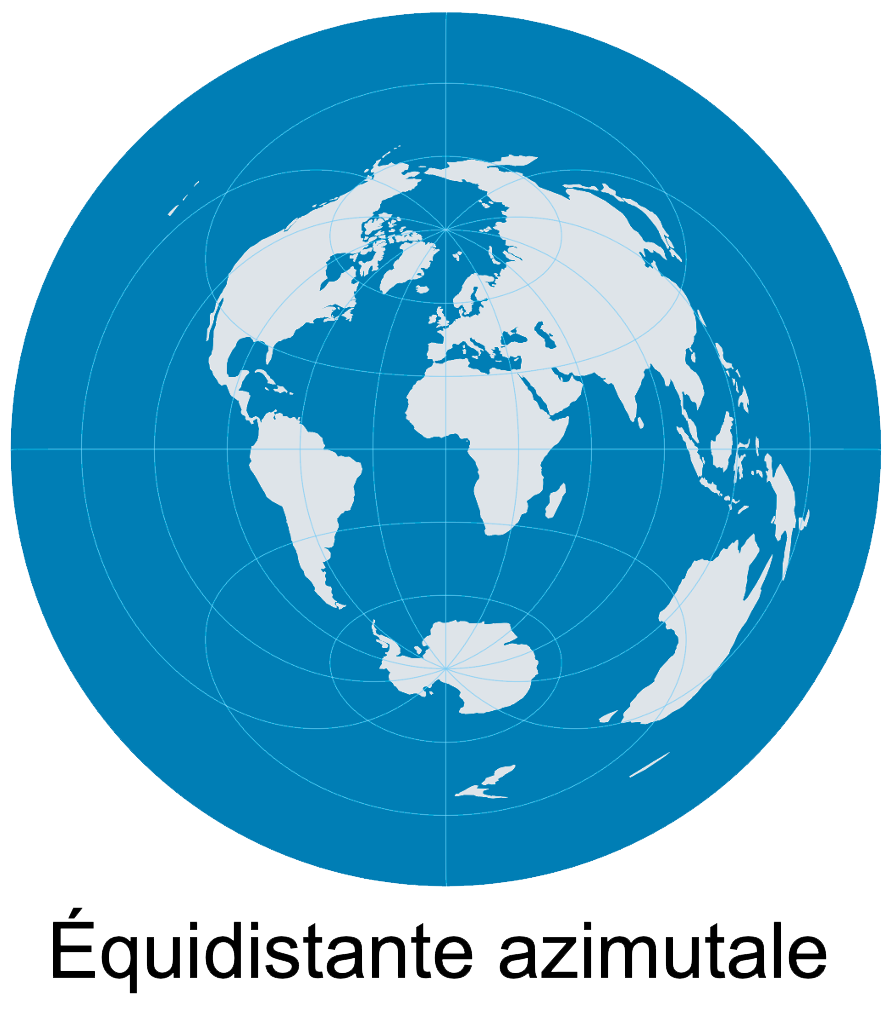
Equidistance (Azimuthal Equidistant)
Preserves distances
Distances from the central point are accurate, but not distances between arbitrary points
- Useful for direct flights, radial maps, proximity analyses
- Does not preserve shapes or global areas
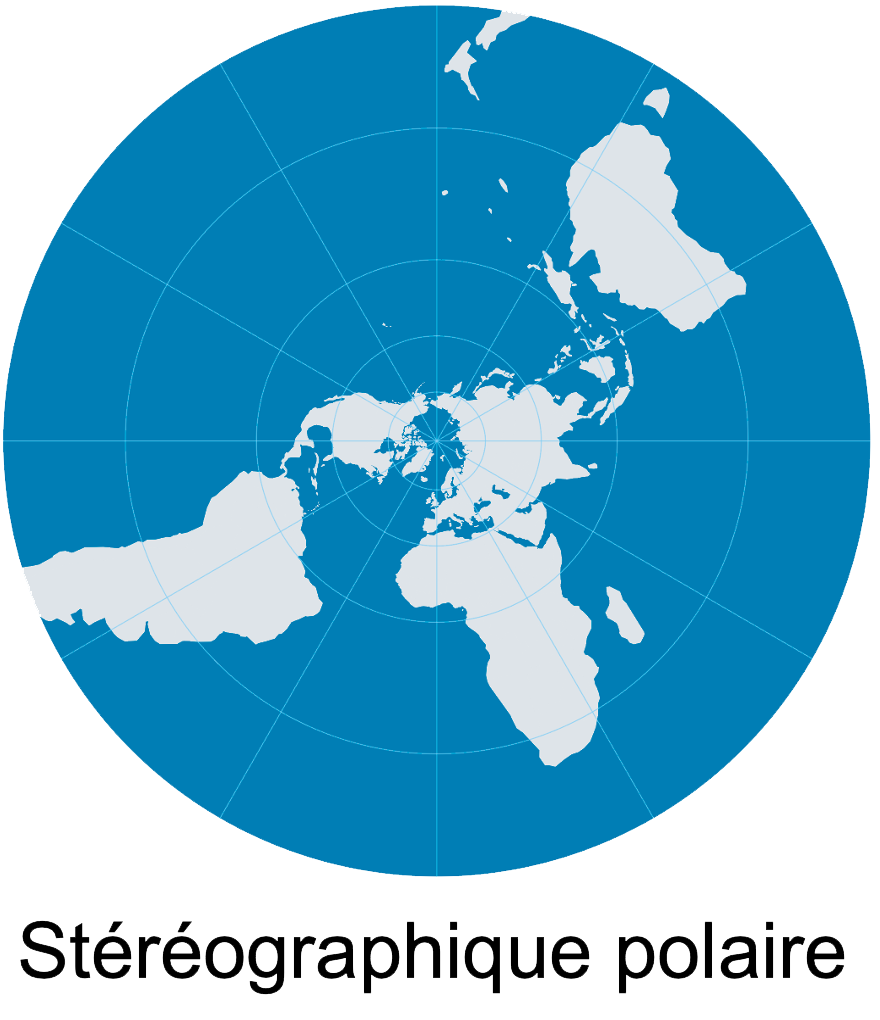
Azimuthality (Polar Stereographic)
Preserves directions
Exact directions from a central point are preserved, though local angles are accurate only at that point. Shapes become increasingly distorted as they move away from the center.
- Practical for air routes, satellite maps, polar views
- Accuracy decreases away from the central point
Which Projection Is the Most Common?
Mercator and Google Maps
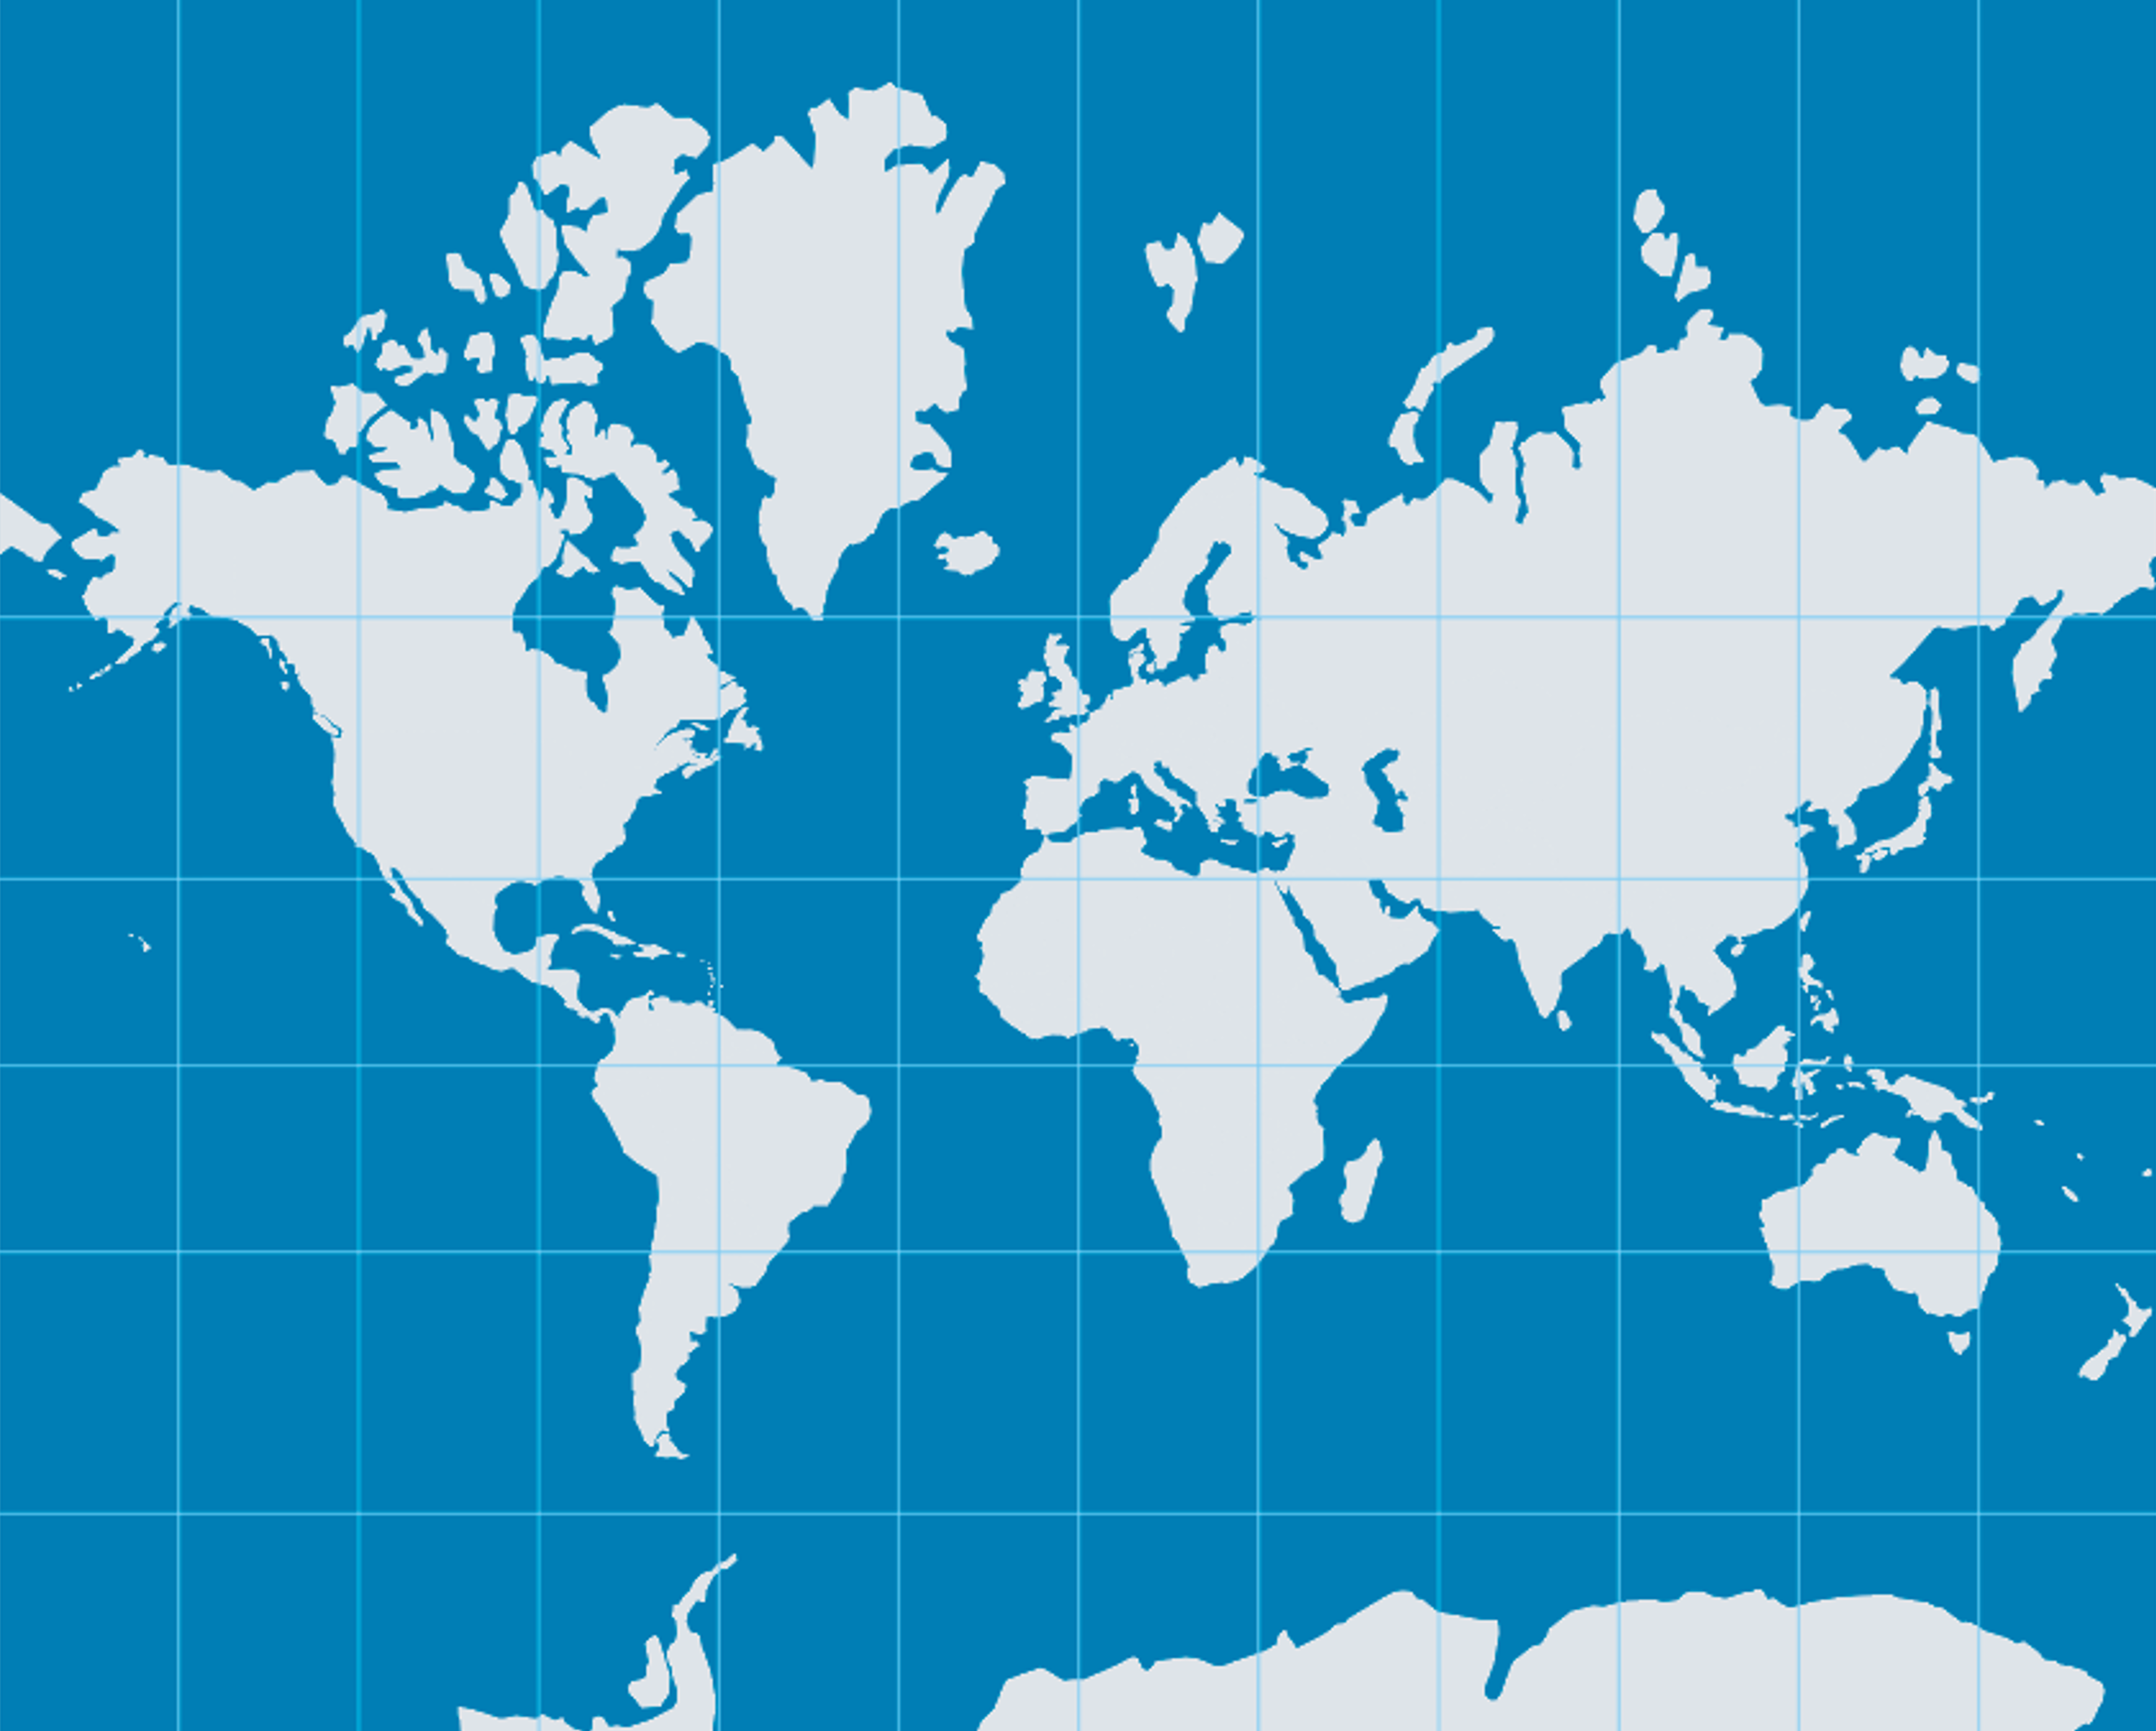
Expertises like Google Maps use a variant of the Mercator projection, but this projection strongly distorts areas, especially farther from the equator. For example, Greenland appears as large as Africa, even though it is 14 times smaller. This gives a misleading impression of the spatial importance of high‑latitude regions.
This distortion is dramatic at small scales (world or continental maps), but becomes nearly imperceptible at large scales, such as mapping a city or region.
The Mercator projection, created in 1569, is a cylindrical conformal projection. It was designed for maritime navigation: thanks to its angle‑preserving property, loxodromes (constant‑bearing routes) appear as straight lines. This made it the reference for nautical charts for centuries.
Which Projection Is the Most Common?
Which Projection for Small Territories?
For highly precise maps of small territories, local adapted projections are often used to minimize distortions within a defined area. This is the case for the Universal Transverse Mercator (UTM) and Modified Transverse Mercator (MTM) systems.
The UTM system divides the globe into 60 longitudinal zones, each 6° wide. Within each zone, a transverse cylindrical conformal projection centered on a meridian is used, ensuring excellent accuracy for distances and local shapes. It is used in most modern topographic maps.
Maps of Québec
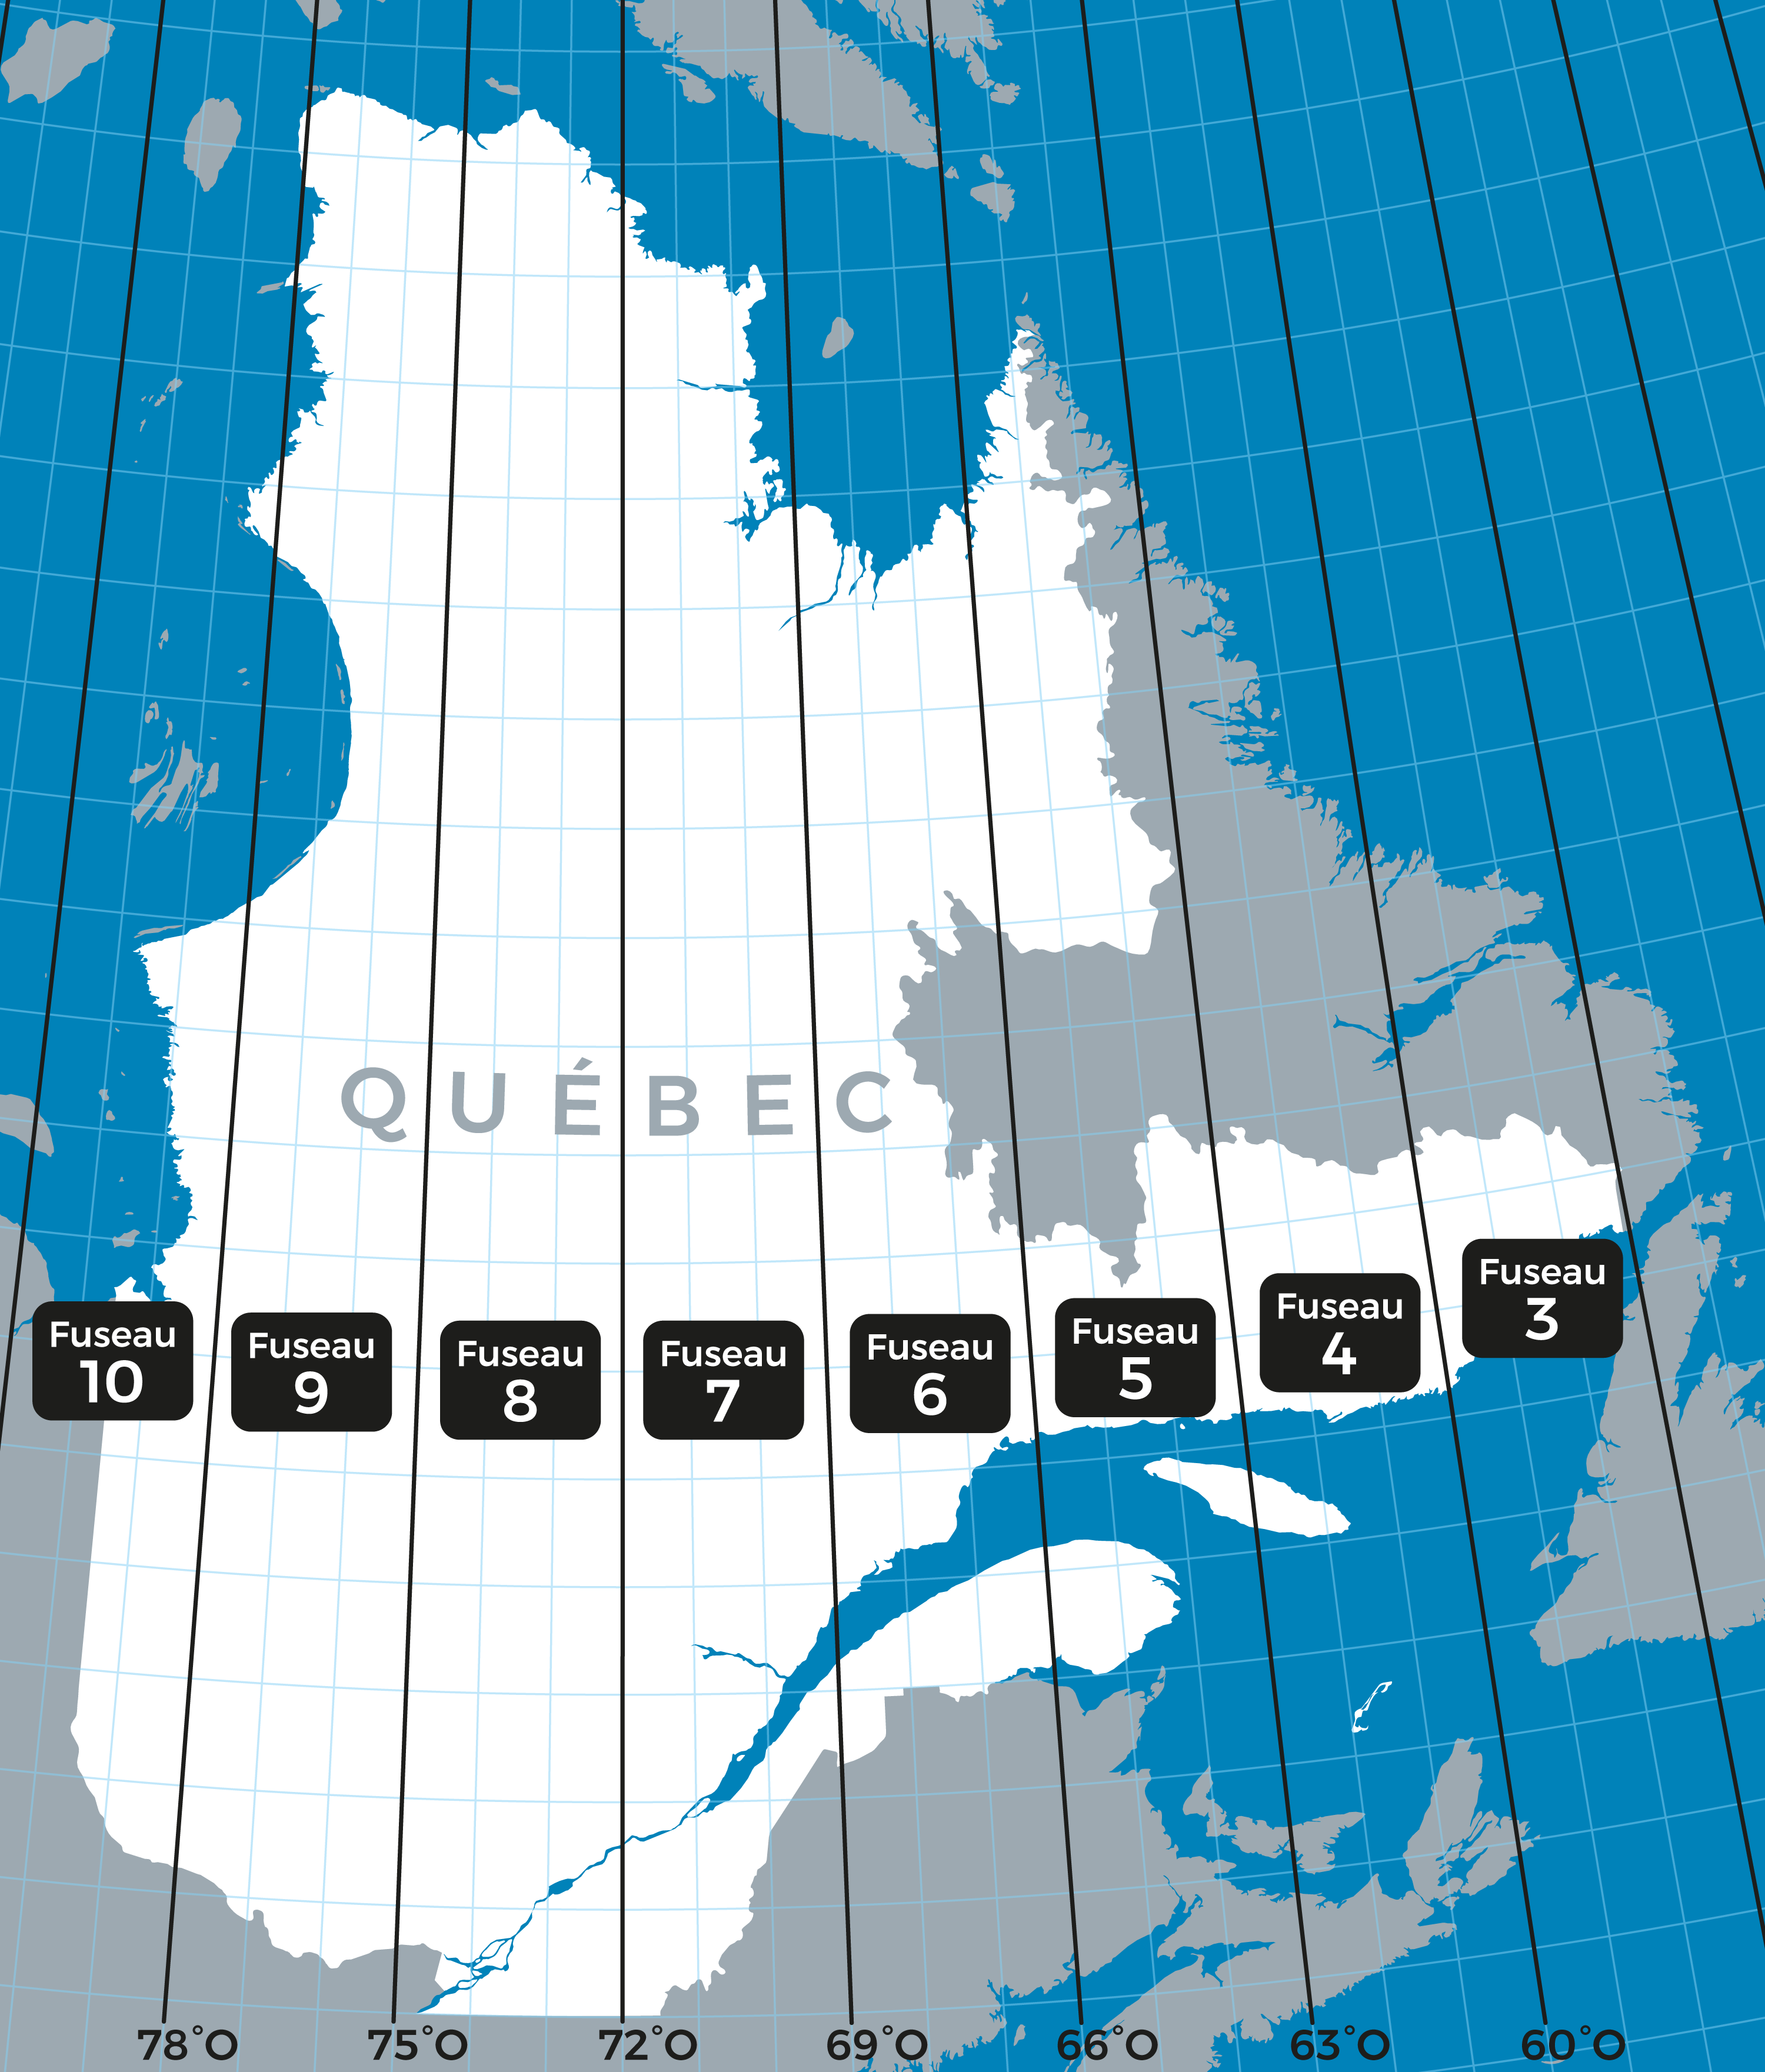
In Québec, the MTM system is often preferred. It works like UTM but uses narrower 3°‑wide zones for even greater precision. Each MTM strip is associated with a false central meridian and is adapted to the particular geometry of Québec’s territory, especially for cadastral surveys, land‑use planning, and engineering work.
These systems are not designed to represent the entire world, but they excel at detailed large‑scale mapping (e.g., a city, a region, an infrastructure corridor). They are perfect examples of projections optimized for very localized use, with parameters calibrated to geographic position.
For Maps of Canada
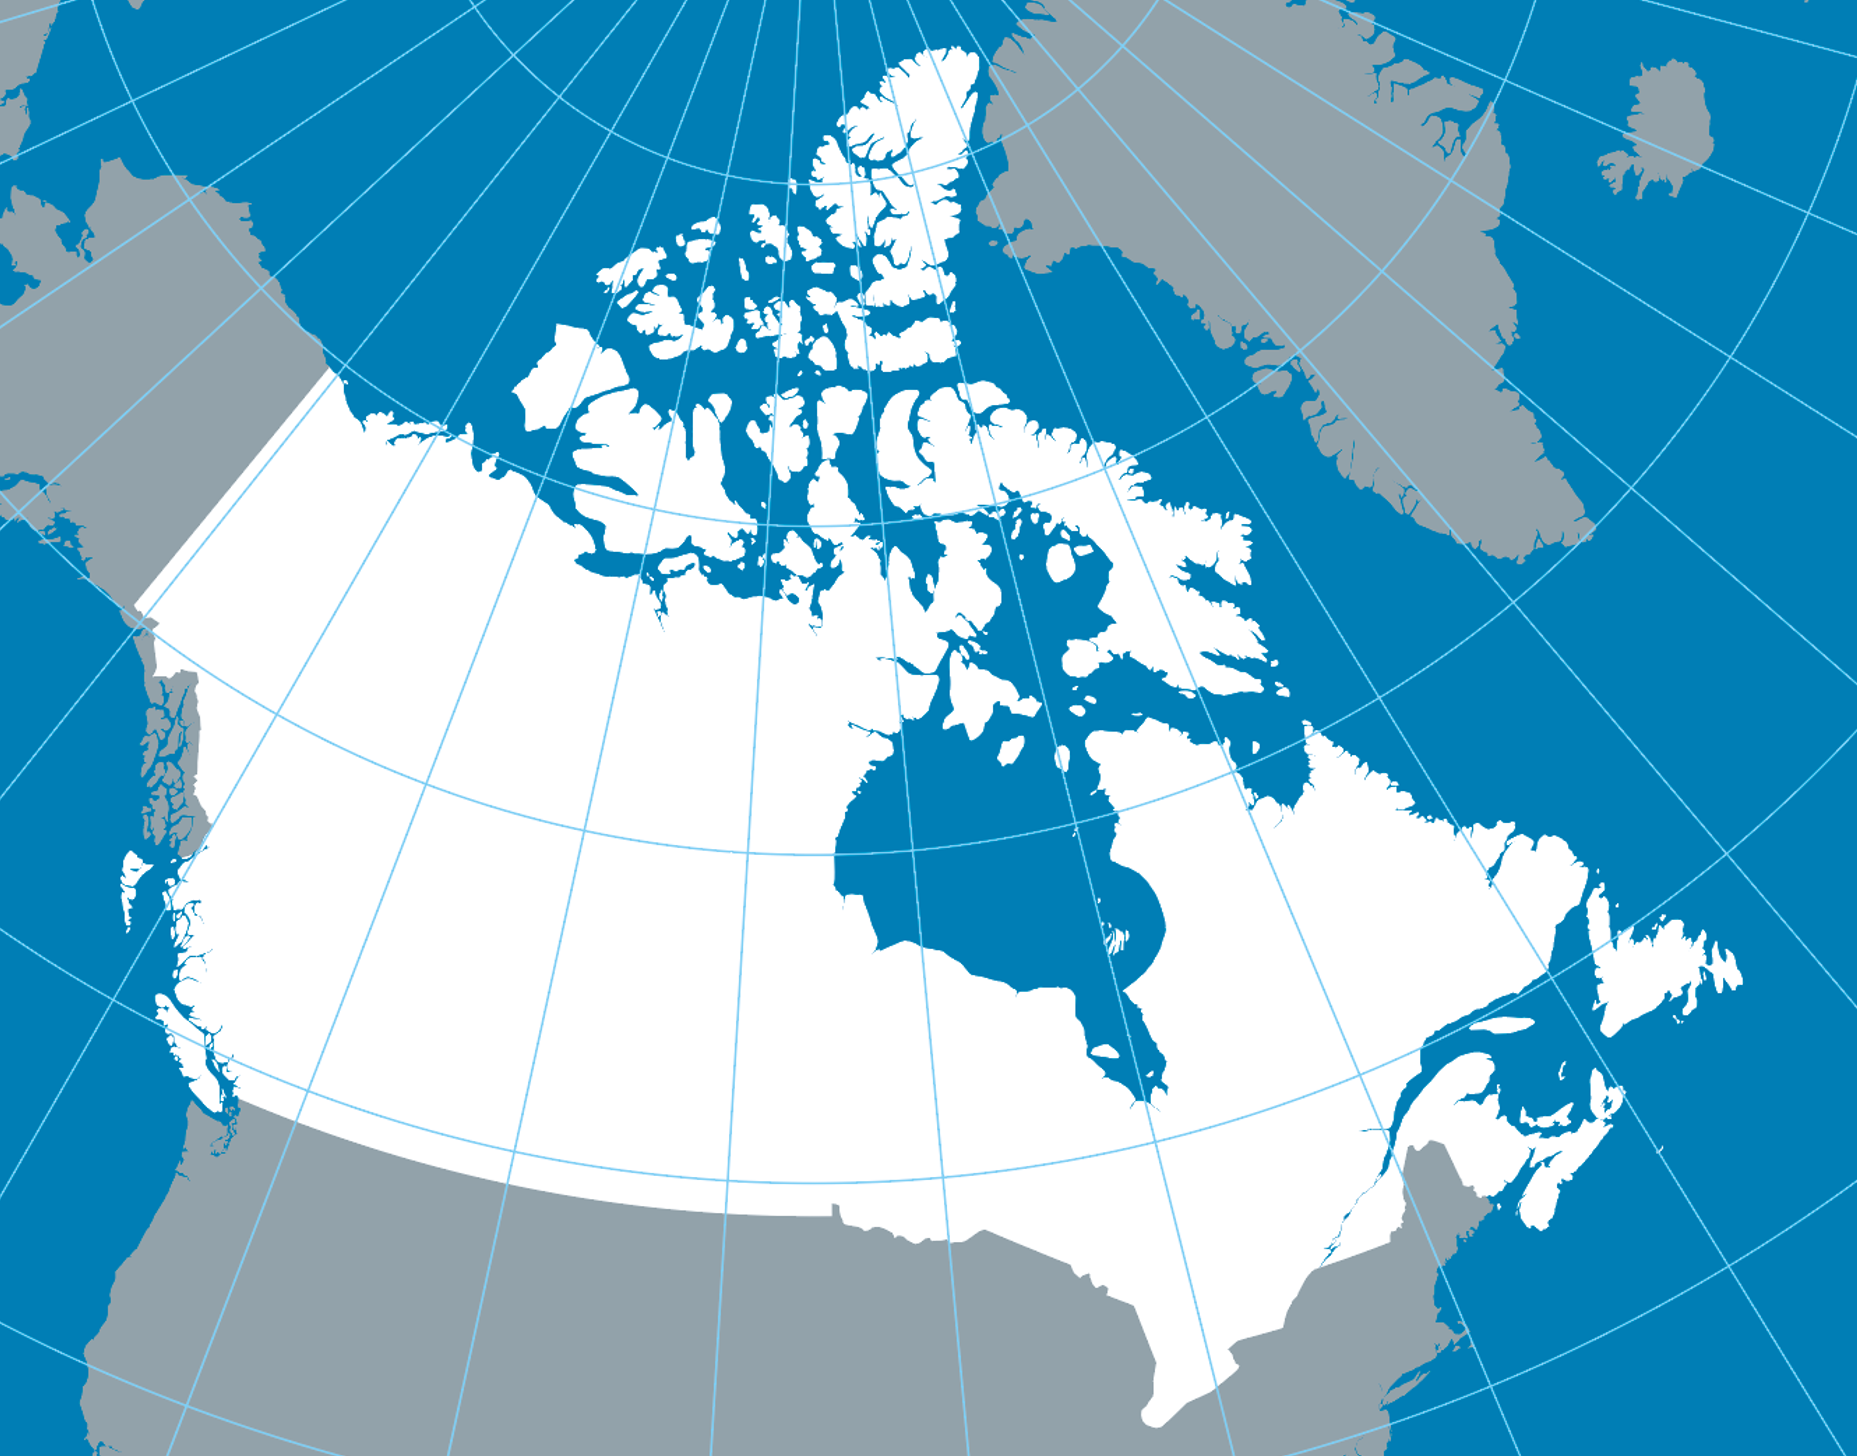
Unlike Mercator, the Lambert conformal conic projection is ideal for regions that extend east–west. It is widely used in Canada, especially for mapping Québec, Ontario, and the western provinces.
It preserves local angles, ensuring faithful representation of shapes at the regional scale while limiting distortions.
Parallels and Meridians: A Grid for Understanding
Meridians are north–south lines, perpendicular to the equator.
Parallels are horizontal circles parallel to the equator, corresponding to latitudes.
These lines form the geographic grid on which all projections rely.
A Projection Is Never Neutral
Every projection is a choice based on intention:
- Facilitating navigation
- Preserving area
- Producing a visually balanced map
But sometimes these choices reinforce geopolitical imaginaries. Mercator, for example, long dominated school atlases, placing Europe at the center and exaggerating the size of northern countries. Conversely, the Peters projection, more faithful to area, was promoted to highlight representational inequalities.